n
Goto http://www.CMPForYou.com;

Wednesday, August 7, 2013

We can look at many markets around the world where we are getting SELL signals.
Look at India

The above chart clearly shows that the Indian Stock market is heading lower and gave a sell signal 8 trading days ago.

Australia: Here again we got a sell signal on heavy volume last night.

Japanese NIkkei after going up for 4 days on decreasing volume is giving a SELL signal. It went down 4% last night. Soon those kinds of declines will happen in US markets

Hongkong Market also gave a SELL signal last night

Brazil market also give a SELL signal yesterday after a half hearted rally since July 8.
This market has been going down since Jan 1, 2013 Soon it will make new lows below 2009 lows.
FTSE & DAX  gave a SELL signal also today.( Charts for  6:30 AM PT below


We  got a SELL signal on DJI & SPX ( or SPY) yesterday. No SELL signal on NASDAQ yet. RUSSELL 2000 will give a SELL signal today. We have been warning about this decline since Aug2. READ our Blog of Aug. 2
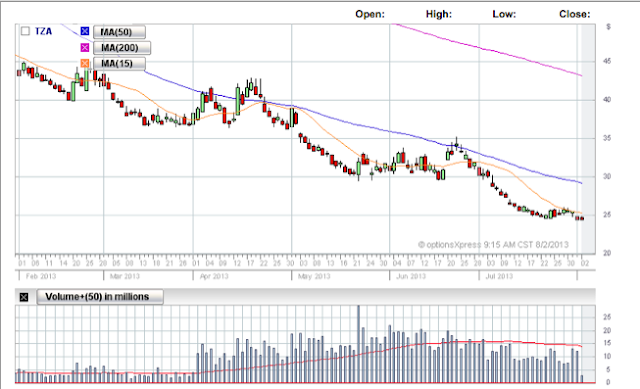
TZA remains the best BUY for this decline.

DJI (at 6:40 AM PT)


SPY( 6:40 AM PT)

IWM (ETF for RUSELL 2000 ) 6:45 AM PT


TZA ( Triple Bearish ETF) 6:45 AM PT ( Last 5 days)
To Buy the book go here 

Tuesday, August 6, 2013

We will give the market status as of  yesterday. We have not had a SELL signal so far per the criteria in our book in DJI, SPY, SPX, NASDAQ, QQQ, DJT APPLE etc We are getting closer . We have been saying since last Thursday that the rally to new highs was just a trap  giving the insiders  ( BIG MONEY) an opportunity to sell near the top. We had the lowest volume of the year yesterday. Only fools are buying near the top and insiders are happy to sell to them. Like a giant tanker , it takes time to reverse this rally.

DJI

QQQ
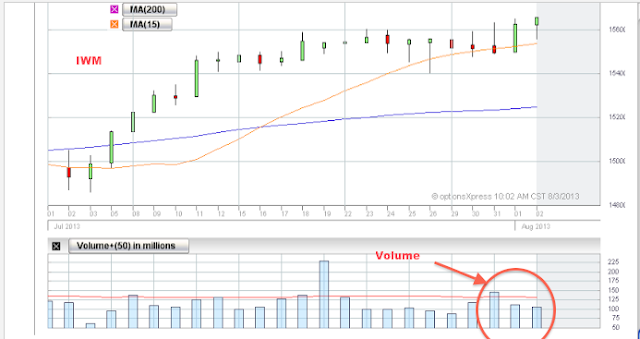
IWM

IWM which corresponds to RUSSELL 2000 hits a new high but at the lowest volume of the tear. 
Unless a new high is confirmed buy volume , it is considered to be an anomaly as we explained in detail in our last post.

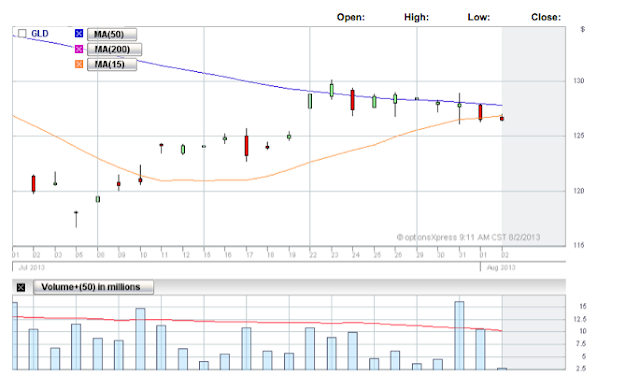
Gold and Silver also gave a SELL signal on Friday and the decline is continuing. See below the charts of GLD ( Gold ETF)  and SLV as of 7 AM today
Silver ETF SLV
WE will not be surprised  if Gold & Silver make new lows below last month's low. We fully expect that Dollar will make a new high soon and that will give a reason for gold to make a new low.

As of 7 AM today we have a SELL signals in all stocks. This will be an extended decline. We will know when the decline . The best stock to buy is TZA ( Triple Reverse ETF of RUSSELL 2000)

TZA  chart  As of 9:30 AM PT
 

Friday, August 2, 2013

Yesterday 's rally was a trap setup by Insiders or so called Smart Money to sell  near the  highest level all the purchases  they made near the lows. The next step is to take the market lower  to start accumulating inventory  near the lows again. We have been telling you that we had not had a sell signal on DJI , SPX and NASDAQ as explained in our book. Let us look at various charts to explain. For SPX we will use the chart of SPY and for Nasdaq we will use chart of QQQ.


This chart clearly shows that even though the market went up it was on low volume. However on Wednesday, we had a very bearish signal of Shooting star with heavy volume which was predicting that the market was being set up for an eventual decline with  specialists and market makers and Smart money selling near the peak. This is why we use candlestick charts to see any anomalies developing .

The above chart of shooting star shows that weakening is going to develop soon . This was confirmed yesterday when the markets made a new high but volume was very low.
We want to say it again that we have still not gotten a sell signal on DJI, SPX, SPY, QQQ, or Nasdaq.

QQQ

SPY
Now look at the interest rates . Long term bonds ETF TLT made a new low with heavy volume.
The long term interest rates will be determined by the Market and not by Federal Reserve. They know this . That is why the tapering will start in September, 2013. Any rallies in long term interest bonds will
not last long.

We do not look at fundamentals to see where we are going as far as the markets are concerned.
July employment increased by only 160,000 compared to 195000 in June. Federal Government is manipulating again by telling us that the unemployment  is 7.4% compared to 7.6% last month. Why do they try to fool us?

The charts we plot are usually 6 month charts. to see the shooting star more clearly, we would like to show the one month charts below. The last bar on these charts is till 7 AM ( Pacific) today. (The volume is not for the whole day).
QQQ one month

DJI one month

SPY one month
Those who are not familiar with candle stick charts, please learn them to understand them so tht you can make better decisions . Price alone is not enough. We need to look at volume to validate any up or down moves. Yesterday's moves were not validated by volume. Therefore it was a weak move and was an anomaly and will be completely reversed soon. This is validated by Elliott Wave Theory which says that we are now in the 5th of 5th leg upwards and the rally is near an end rather than at the beginning of a new move up.
You may  want to know what is candlestick indicator near the bottom. It is called the Hammer. See the chart below
Note several hammers appeared in mid JUNE when the current rally started.
Let us look at ETF for gold till 7 AM today.

GLD ONE MONTH

The above chart is for TZA. Heavy buying yesterday and day before near the lows.
The insiders are keeping all stocks near highs and selling short while the retail investor is buying. Near the close they may take it even higher . It is easy to move Nasdaq  by moving merely APPLE stock which has a weighting of almost 20%.
END of DAY Charts Showing the Volume is going down on a relative basis:
SPY based on SPX


DJI

Any increase in volume Friday  compared to Thursday also shows that insiders are selling near the top.

IWM which is ETF for Russell 2000 ( RUT). Market going up is not validated by volume on a relative near term basis .

The Price Earning ratio on Russell 2000 is nearing 49 - which is ripe for a correction.
TO BUY the book Click here

http://www.makemoneybullorbear.com/p/blog-page.html

Wednesday, July 31, 2013

We have insiders which include  Market Makers, Specialists, Hedge Funds , Large Operators and Professional Money. Their main job is to buy at the bottom and fill up their coffers. Then they distribute this stock at the peak to retail investors and speculators. Let us look at the few charts

TNA  This is reverse of TZA. Look at how they load up at the bottom and Sell at the top at the highest prices.All rallies now are nothing more than distribution of stocks near the top to retail investors.

SPY which is ETF for SPX. Here again any new highs are merely distribution near the top.


The way to distribute stock is to move it Up &; Down with GOOD news. They will move the market up in the morning and close near the low with several UP & Down Moves all day long. It is again happening today on good news. They may even make a new high in DJI, SPX & Nasdaq to suck in those who shorted a few days ago or who were hesitating till today.

 Once they have distributed all shares near the top, they will take the market down again to fill  up their coffers again near the lows.  The best way to distribute stock is to use media to publish good news. The retail investors BUY because they are afraid of missing a rally. It is all because of greed.

 All stocks, Gold &  Silver are being manipulated so that suckers can buy and insiders can get out.  Exchange markets are manipulated by Governments around the world but eventually they fail.  Look at what is happening to NIKKEI.
They showed today that  US GDP was up 1.7% today. Guess what. It is based upon new way of calculating GDP . Othrwise GDP would have been down to -0.5 probably.

The market is like a large  tanker. It takes time to change direction. Look at SPY . They have kept it near the top for 11 trading days. Folks, they are  distributing stocks to the willing lambs before they butcher them mercilessly.

Why should not they do it? They make billions and SEC lets them do it legally. The best way for us is to follow the insiders and sell when they sell & buy when they accumulate.

We have a SELL signal on DAX ( German Market) today. Here again they are distributing stocks near the highs.


Nikkei continues to go lower . It has still long way to  reach its bottom. Any rallies now will help the insiders distribute to the retail investors.

GOLD & Silver also gave SELL signal today as Dollar has started strengthening .
GOLD GLD (ETF). Unless Gold makes a new high above recent highs, it is going lower . So is the case with Silver.


Silver SLV ETF
TLT  Long Term Bond ETF hit a new low and 10 year treasuries hit 2.68%. Where is the FED?


Monday, July 29, 2013

If we look at 20+ Treasury Bond ETF    TLT ,  it is sitting near the lows even though stock market has been going  higher. It tells the story better than what the Fed Heads tell us that they will continue to keep rates low. These bonds made a high(when the rates were low) in early May and are sitting near the lows. 10 Year Treasuries are at 2.58% also way above 1.45% in early May.Imagine how much money  all the bond holders have lost. Most bond funds are negative for 2013.  This massacre will continue. It will be even worse for Municipal bonds after what happened  due to Detroit bankruptcy.


Gold is in a holding pattern. It needs to go above  above $1337 for the rally to continue otherwise we could start the decline below previous lows. Take a look at GLD chart. There is no sell signal yet

Nikkei continues to go lower reaching a 4 week low today with a decline of 3.32% today

Dow, SPX & NAsdaq did not give SELL signals on Friday but it is getting closer. We will know after 7 AM which way the market wants to go. Continue to sell your long positions to lock in your profits.

Dollar has started rising against other currencies today.This may be the start of a big rally on a short term basis.
Dow Jones transportation continues to go lower after the SELL signal last week.

TZA just gave a BUY signal , as both RUT & IWM gave SELL signals

Here is RUT chart giving a SELL signal


Here is IWM chart giving a SELL signal

Friday, July 26, 2013

As yen strengthens  against other currencies, Nikkei ( Japan) took a big hit today and so did the Shanghai  ( China) market. DAX is also ready to give a SELL signal.
SHANGHAI


NIKKEI


DAX

DJI will give a SEll signal if it goes below 15450

 IWM will  Give a SELL Signal  if it goes below 103.35

Buy TZA to day even though we do not have a BUY signal yet


The above chart shows clearly   how we  used our trend following approach to make 25% profit recently with TNA.( See Last Chapter of  our book)

NASDAQ will give a SELL signal if it goes below 3573


Powered by Blogger.