


Yesterday 's rally was a trap setup by Insiders or so called Smart Money to sell near the highest level all the purchases they made near the lows. The next step is to take the market lower to start accumulating inventory near the lows again. We have been telling you that we had not had a sell signal on DJI , SPX and NASDAQ as explained in our book. Let us look at various charts to explain. For SPX we will use the chart of SPY and for Nasdaq we will use chart of QQQ.

This chart clearly shows that even though the market went up it was on low volume. However on Wednesday, we had a very bearish signal of Shooting star with heavy volume which was predicting that the market was being set up for an eventual decline with specialists and market makers and Smart money selling near the peak. This is why we use candlestick charts to see any anomalies developing .

The above chart of shooting star shows that weakening is going to develop soon . This was confirmed yesterday when the markets made a new high but volume was very low.
We want to say it again that we have still not gotten a sell signal on DJI, SPX, SPY, QQQ, or Nasdaq.
QQQ

SPY
 Now look at the interest rates . Long term bonds ETF TLT made a new low with heavy volume.
The long term interest rates will be determined by the Market and not by Federal Reserve. They know this . That is why the tapering will start in September, 2013. Any rallies in long term interest bonds will
not last long.
 We do not look at fundamentals to see where we are going as far as the markets are concerned.
July employment increased by only 160,000 compared to 195000 in June. Federal Government is manipulating again by telling us that the unemployment is 7.4% compared to 7.6% last month. Why do they try to fool us?
The charts we plot are usually 6 month charts. to see the shooting star more clearly, we would like to show the one month charts below. The last bar on these charts is till 7 AM ( Pacific) today. (The volume is not for the whole day).
QQQ one month

DJI one month

SPY one month
 Those who are not familiar with candle stick charts, please learn them to understand them so tht you can make better decisions . Price alone is not enough. We need to look at volume to validate any up or down moves. Yesterday's moves were not validated by volume. Therefore it was a weak move and was an anomaly and will be completely reversed soon. This is validated by Elliott Wave Theory which says that we are now in the 5th of 5th leg upwards and the rally is near an end rather than at the beginning of a new move up.
You may want to know what is candlestick indicator near the bottom. It is called the Hammer. See the chart below
 Note several hammers appeared in mid JUNE when the current rally started.
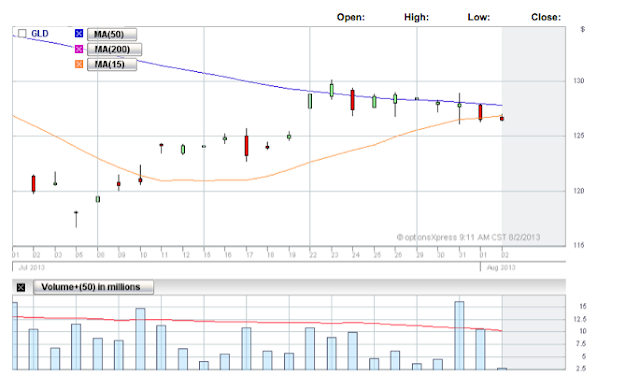
Let us look at ETF for gold till 7 AM today.

GLD ONE MONTH
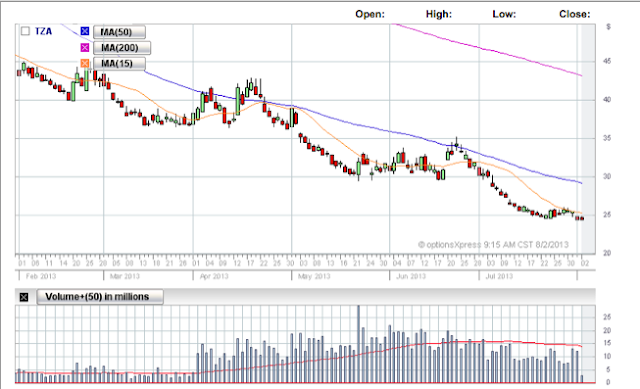
The above chart is for TZA. Heavy buying yesterday and day before near the lows.
The insiders are keeping all stocks near highs and selling short while the retail investor is buying. Near the close they may take it even higher . It is easy to move Nasdaq by moving merely APPLE stock which has a weighting of almost 20%.
END of DAY Charts Showing the Volume is going down on a relative basis:
SPY based on SPX

DJI
 Any increase in volume Friday compared to Thursday also shows that insiders are selling near the top.
IWM which is ETF for Russell 2000 ( RUT). Market going up is not validated by volume on a relative near term basis .
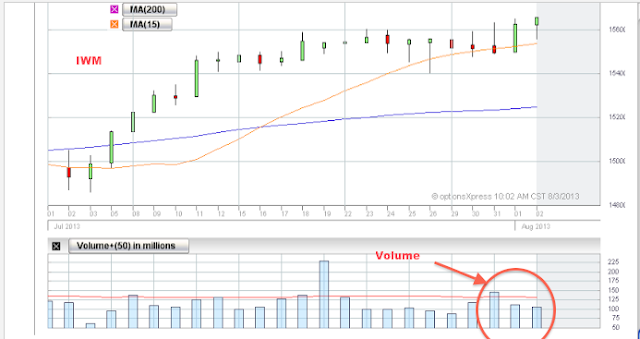 The Price Earning ratio on Russell 2000 is nearing 49 - which is ripe for a correction.
TO BUY the book Click here
http://www.makemoneybullorbear.com/p/blog-page.html

This chart clearly shows that even though the market went up it was on low volume. However on Wednesday, we had a very bearish signal of Shooting star with heavy volume which was predicting that the market was being set up for an eventual decline with specialists and market makers and Smart money selling near the peak. This is why we use candlestick charts to see any anomalies developing .

The above chart of shooting star shows that weakening is going to develop soon . This was confirmed yesterday when the markets made a new high but volume was very low.
We want to say it again that we have still not gotten a sell signal on DJI, SPX, SPY, QQQ, or Nasdaq.
QQQ

SPY

The long term interest rates will be determined by the Market and not by Federal Reserve. They know this . That is why the tapering will start in September, 2013. Any rallies in long term interest bonds will
not last long.

July employment increased by only 160,000 compared to 195000 in June. Federal Government is manipulating again by telling us that the unemployment is 7.4% compared to 7.6% last month. Why do they try to fool us?
The charts we plot are usually 6 month charts. to see the shooting star more clearly, we would like to show the one month charts below. The last bar on these charts is till 7 AM ( Pacific) today. (The volume is not for the whole day).
QQQ one month

DJI one month

SPY one month

You may want to know what is candlestick indicator near the bottom. It is called the Hammer. See the chart below

Let us look at ETF for gold till 7 AM today.

GLD ONE MONTH


The above chart is for TZA. Heavy buying yesterday and day before near the lows.
The insiders are keeping all stocks near highs and selling short while the retail investor is buying. Near the close they may take it even higher . It is easy to move Nasdaq by moving merely APPLE stock which has a weighting of almost 20%.
END of DAY Charts Showing the Volume is going down on a relative basis:
SPY based on SPX

DJI

IWM which is ETF for Russell 2000 ( RUT). Market going up is not validated by volume on a relative near term basis .

TO BUY the book Click here
http://www.makemoneybullorbear.com/p/blog-page.html


2 comments :
Do you think the TNA (RUT) could be in a continuation rally right now? The long term weekly charts show an uptrend with TNA well above its 30 period moving average. The daily short term charts show the 15 DMA acting as support for a couple of days followed by 2 up days that broke through short term resistance. There is no upside resistance now.While the volume has been average it may pick up. The Russel 2000 is generally hard to manipulate by the big money. Do you think it could be being manipulated anyway?
High volume in TNA may mean that insiders are selling. TNA did not make a new high yet even after huge volume today. I leave it to you whether you want to buy near the peak. Elliott Wave Theory also says that we may be very close to the highs as we are in the 5th of 5th Leg.
Another argument is that Advance decline ratio is negative even though the market went up.
Post a Comment